Mycelium Network
Concept
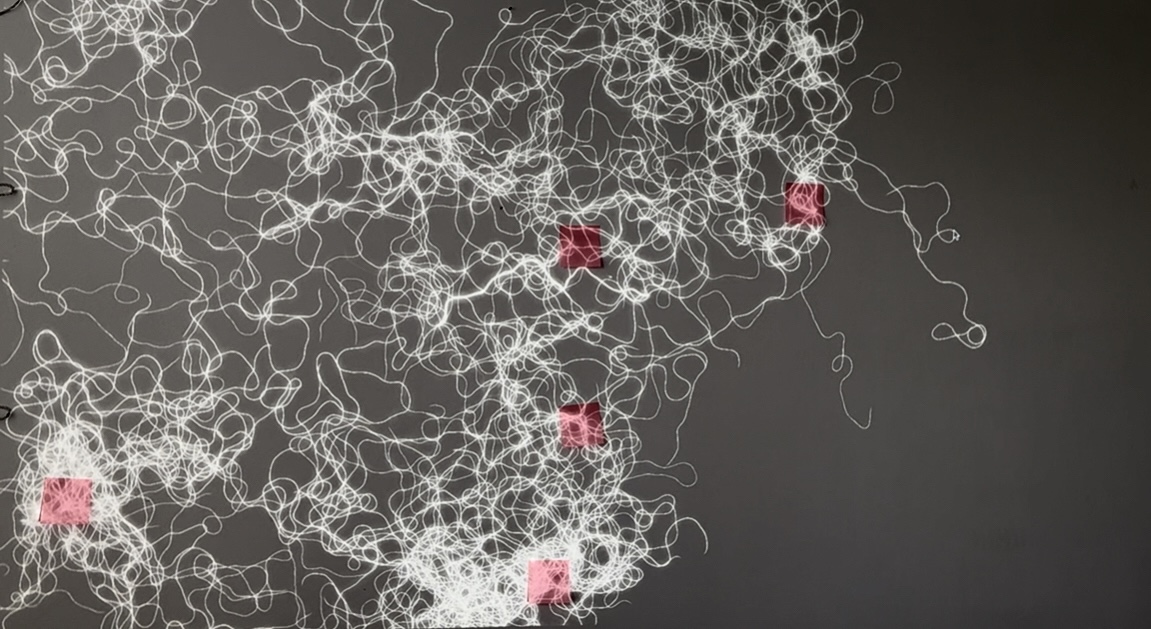
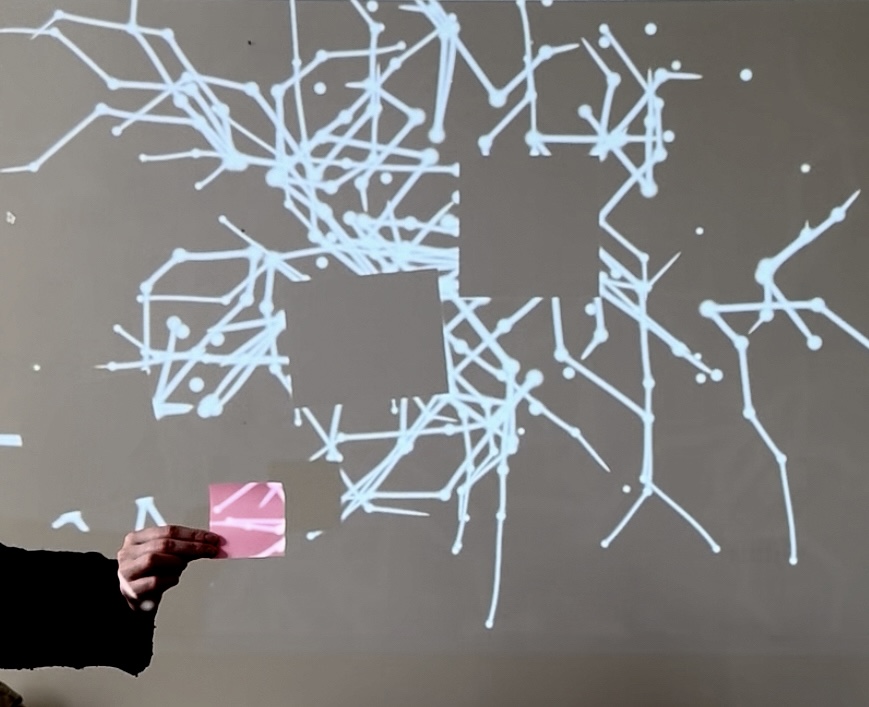
Mycelium Network is a real-time generative installation that uses a camera, projector, and physical Post-it notes to create a living diagram of invisible infrastructure.
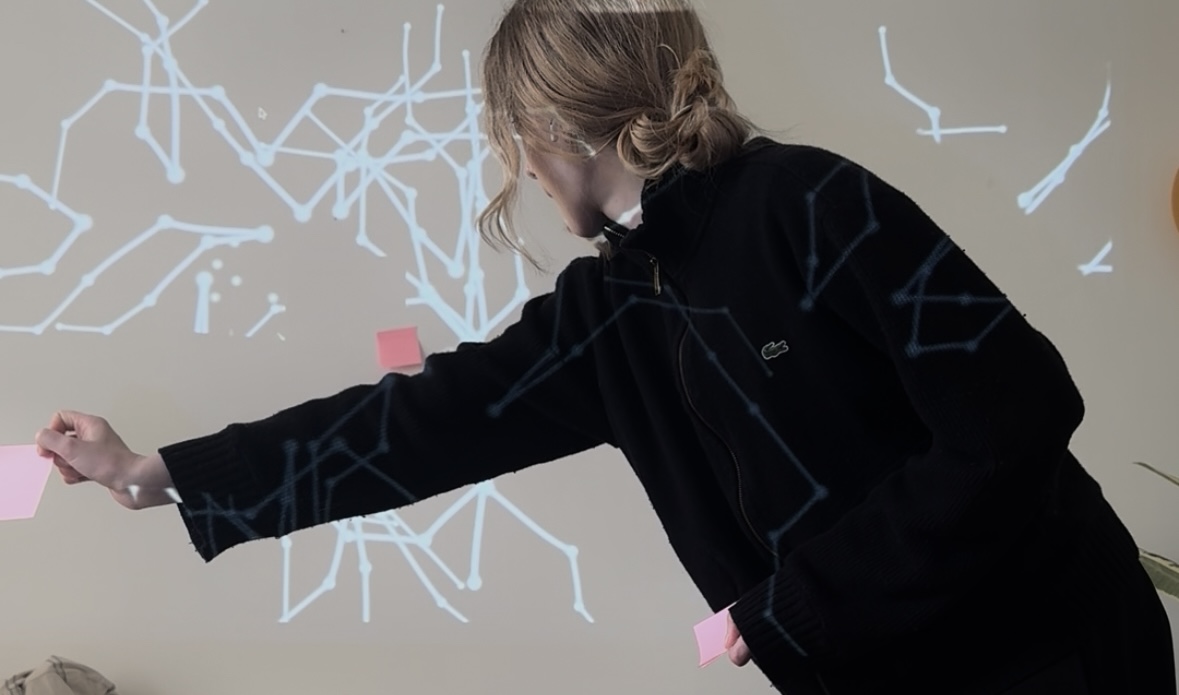
Post-it notes are placed by hand onto a wall. A camera reads their position, shape, and colour in real time. From the edges of each note, the projection grows animated networks: threads, nodes, branching traces that extend outward across the surface, connecting and dissolving as notes are added or removed.
The gesture is simple: stick something to a wall, and something grows from it.
Context
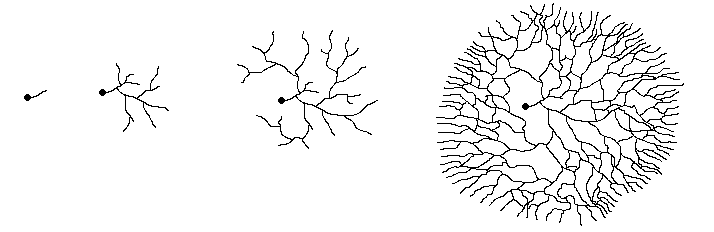
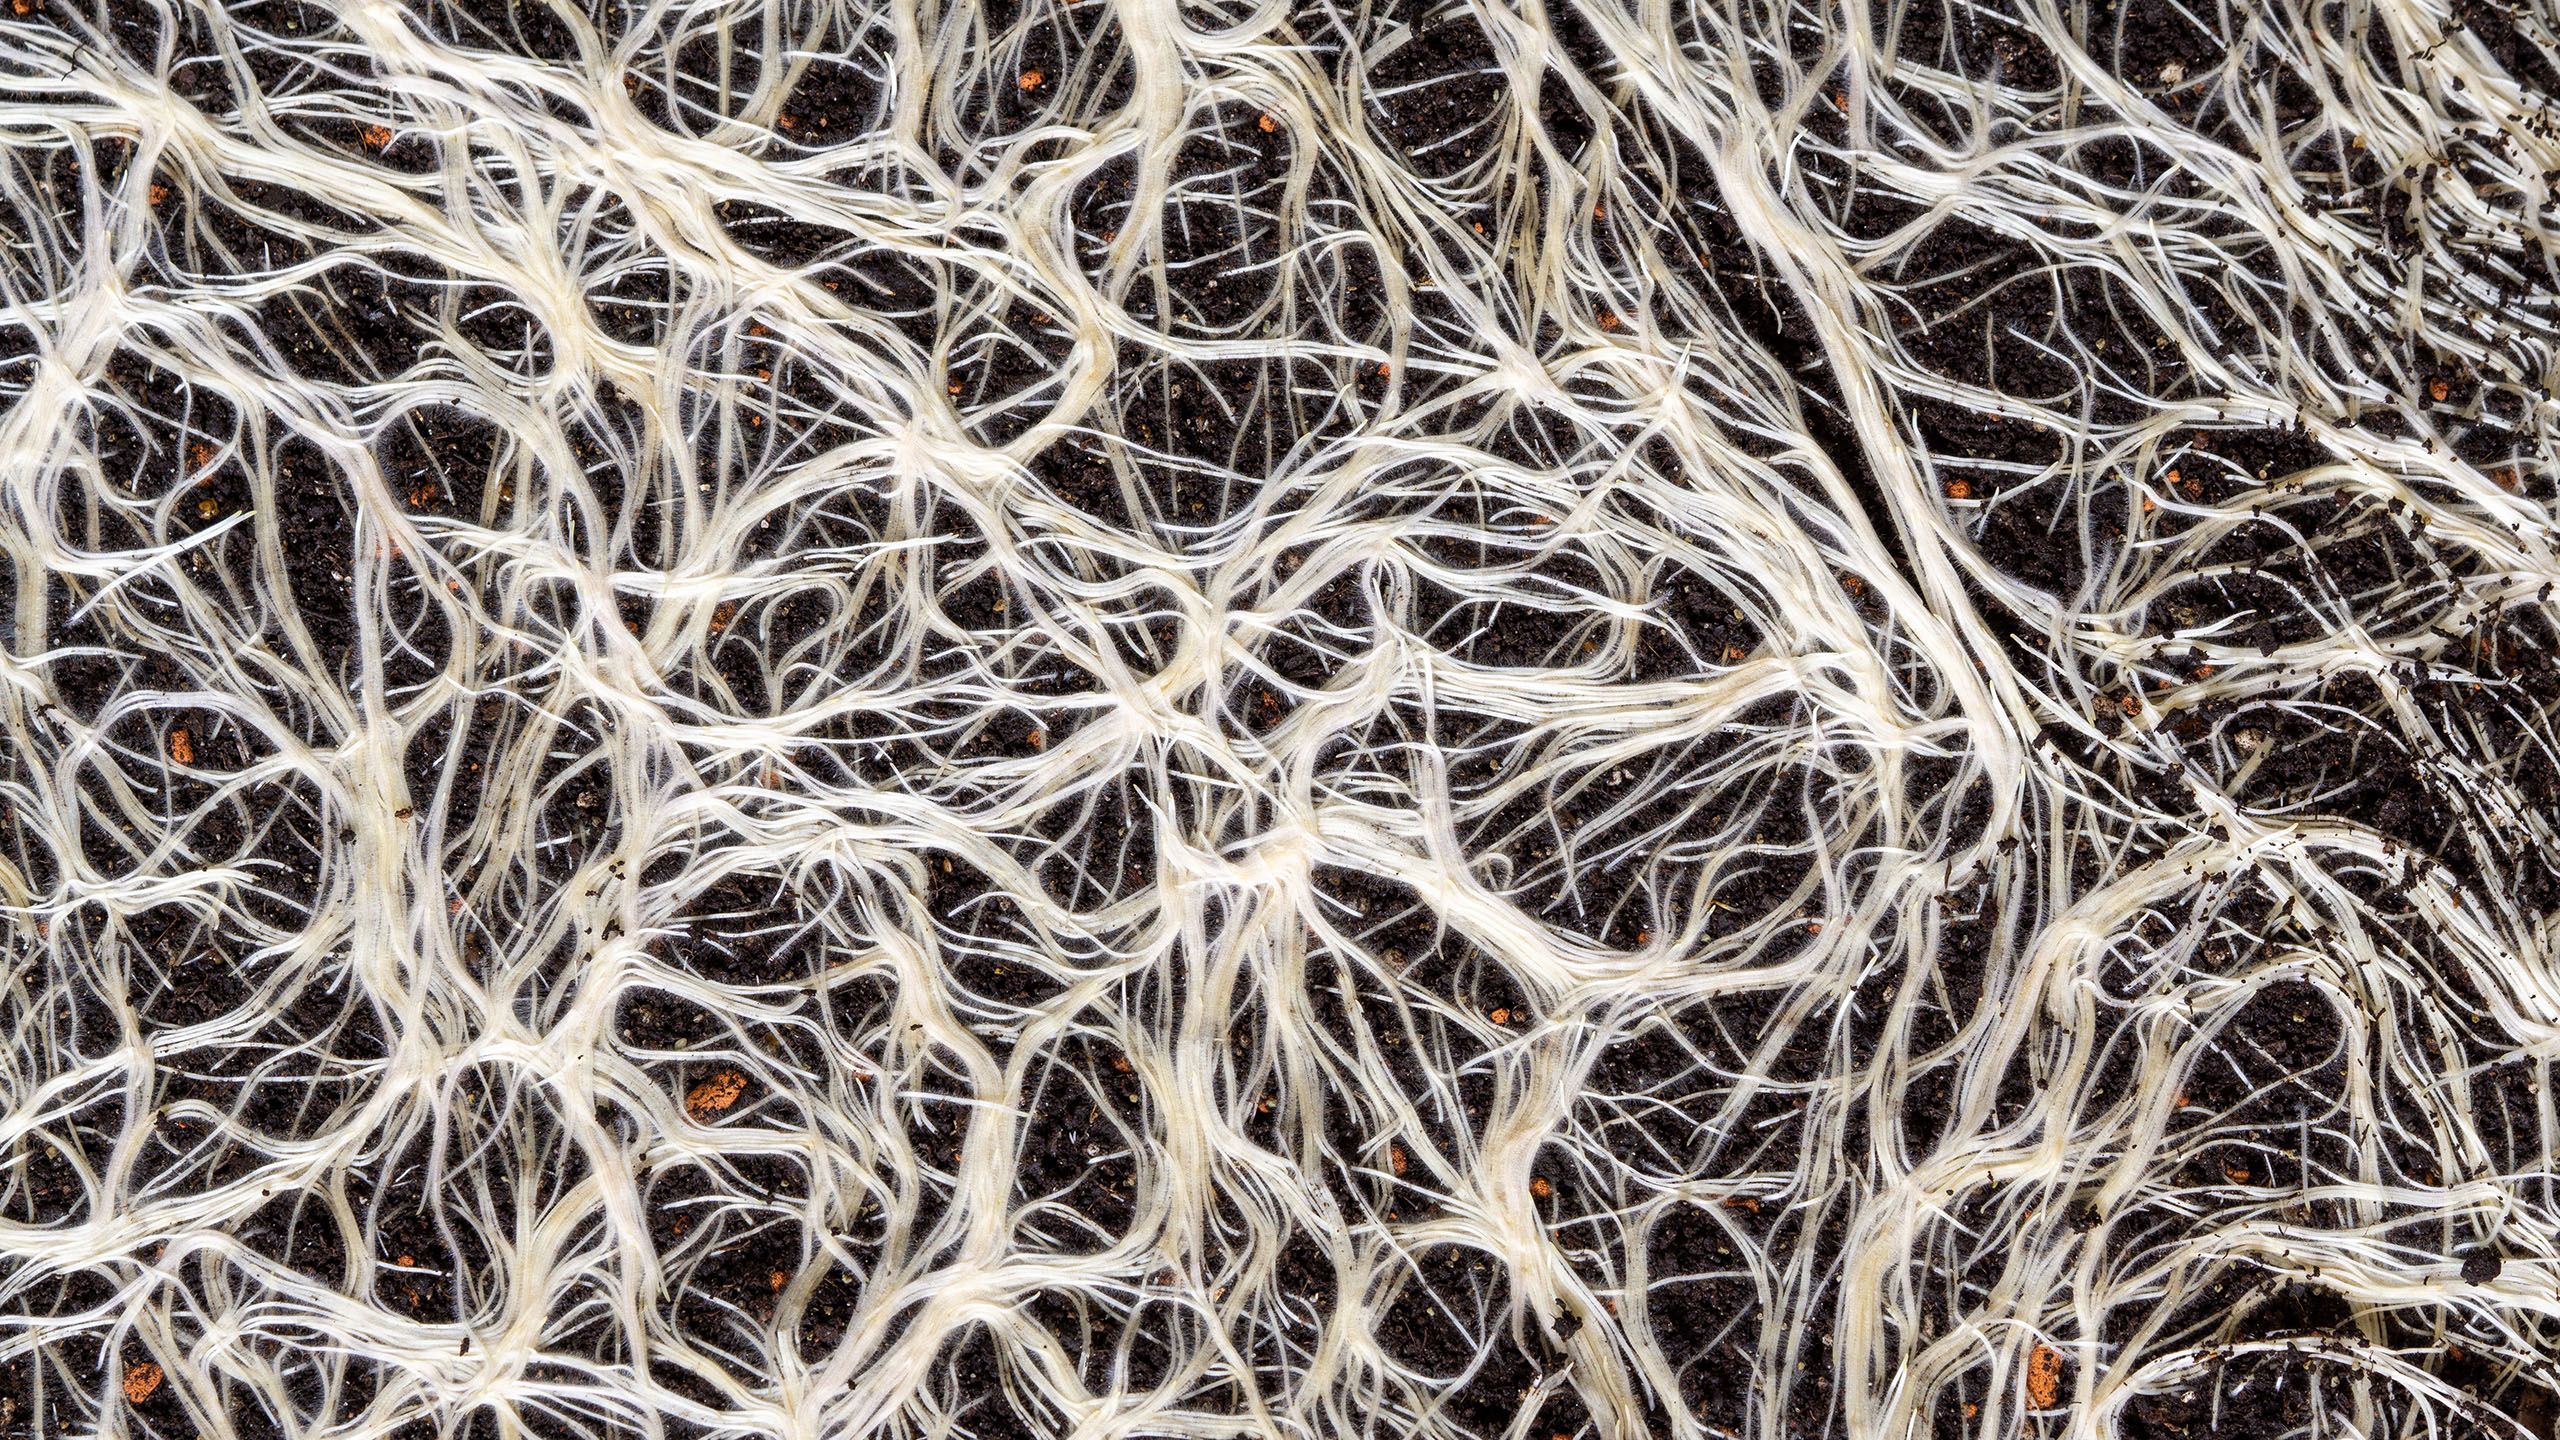
The work draws on the structural parallel between mycelium, the underground fungal networks that connect trees, share nutrients, and transmit signals across forests, and the physical infrastructure of the internet: cables, routers, nodes, switching points. Both are invisible systems that sustain visible life. Both grow organically toward connection. Both are fragile at the edges and resilient at the core.
The Post-it, a disposable object associated with temporary thought, becomes a node in a network that responds, persists, and spreads. Participants can reshape the network in real time by moving, adding, or removing notes. The projection adapts within seconds, recalculating what grows from where.
Installation
Expansion
Biological / ecological — Map real mycelium growth data onto the projection, so the network's shape is driven by actual fungal spread over time rather than simulation. In collaboration with a biology lab, visualise how nutrients or signals move through a real network. Use Post-it colour as a species marker, each colour a different organism, the threads showing documented symbiotic relationships.
Infrastructure / data — Feed in live network data: your own wifi traffic, a server's packet flow, a city's internet exchange point. The Post-its become physical anchors for real nodes. Map undersea internet cable routes, with notes marking landing points on a projected world map. Visualise data colonialism, which nodes send, which receive, where the cables are and aren't.